


Predictability at Peak Demand: Results from Dynamic Pricing


The previous Dynamic Pricing update walked through what was changing at a protocol level with the ArbOS Dia upgrade and why those changes mattered for fee predictability. With Dynamic Pricing now operating through real congestion on mainnet, early observations show strong results on the outcomes businesses care about most: lower price volatility under stress, reduced peak gas price spikes, and faster gas price recovery after demand bursts.
For financial institutions, predictable fees go beyond UX improvements. They directly affect operational costs, reliability targets, and the ability to provide consistent pricing to end customers during market events.
The data in this addendum suggests Arbitrum is already operating with the stability and headroom needed as onchain demand grows. This detailed summary is intentionally data-forward and focuses on performance metrics that show up in production systems, and how they affect user experience.
What this analysis covers
Two complementary views of data are used:
- Cross-chain analysis of fee volatility
Stress periods are isolated and the fluctuation of median gas prices is quantified. This provides a direct lens on how turbulent fees become when networks are busy. - Replay of a real high-load day (Jan 31, 2026)
The same demand trace is replayed through the prior pricing model and Dynamic Pricing to isolate how pricing behavior changes under identical demand but using two different pricing algorithms. Arbitrum is also compared against Base, Optimism, and Ethereum L1 for the same period.
These views are not intended as full cost comparisons and do not normalize for workload mix. They are designed to answer two questions: when the network faces high demand, how stable is pricing, and how quickly does it return to normal?
Results at a glance
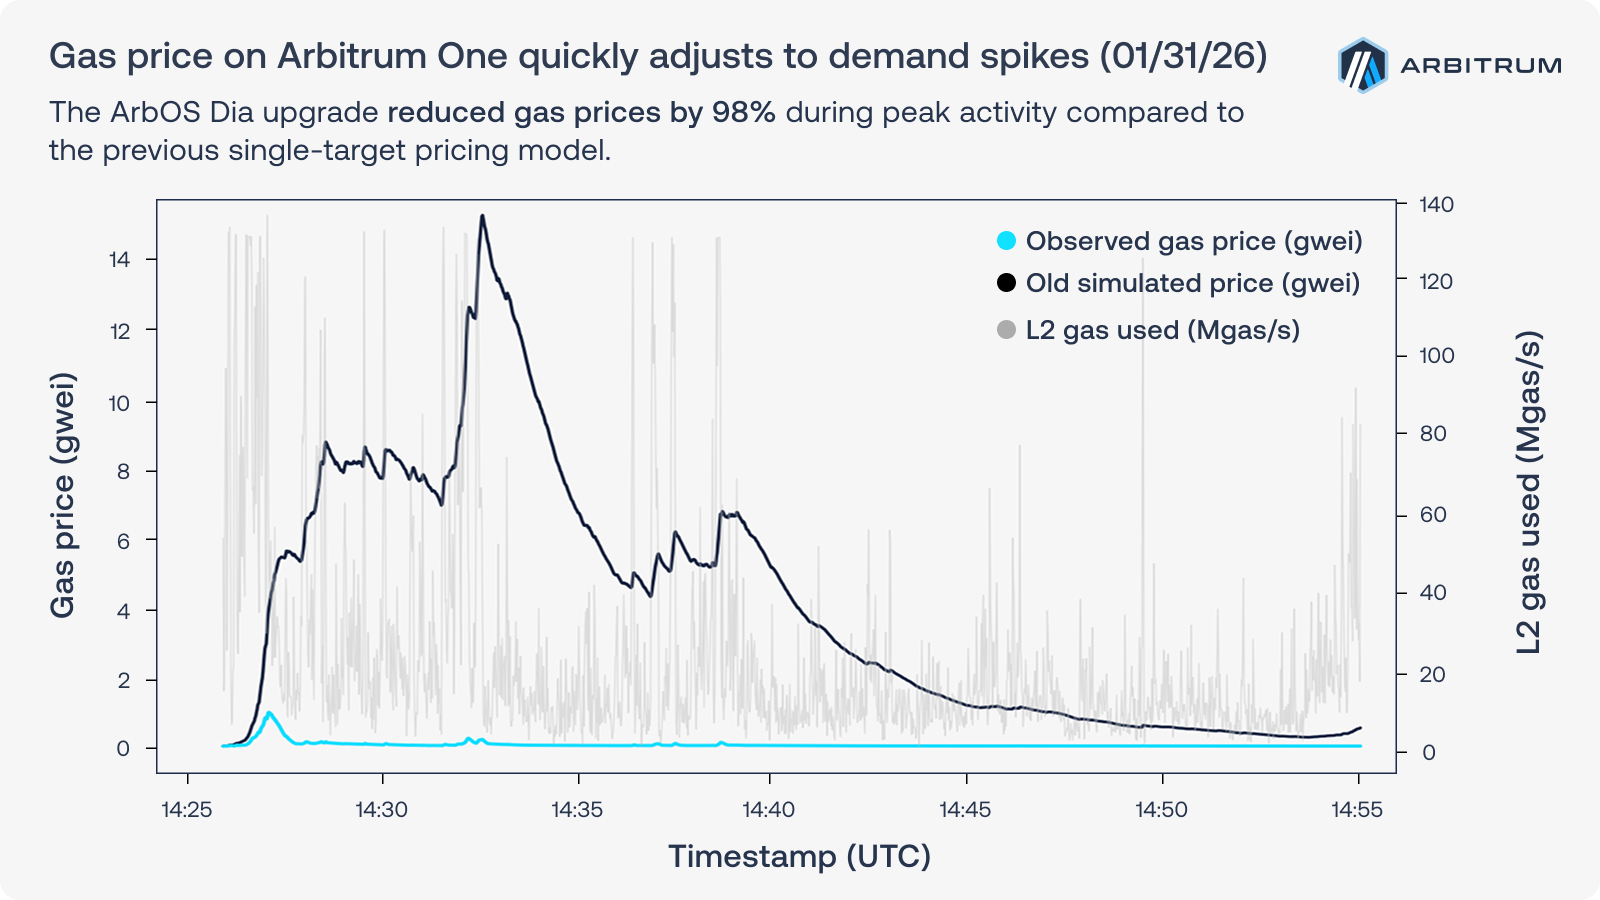
- Lower peak spikes: peak gas price was 98% lower compared to the old pricing algorithm at ~130 Mgas/s demand.
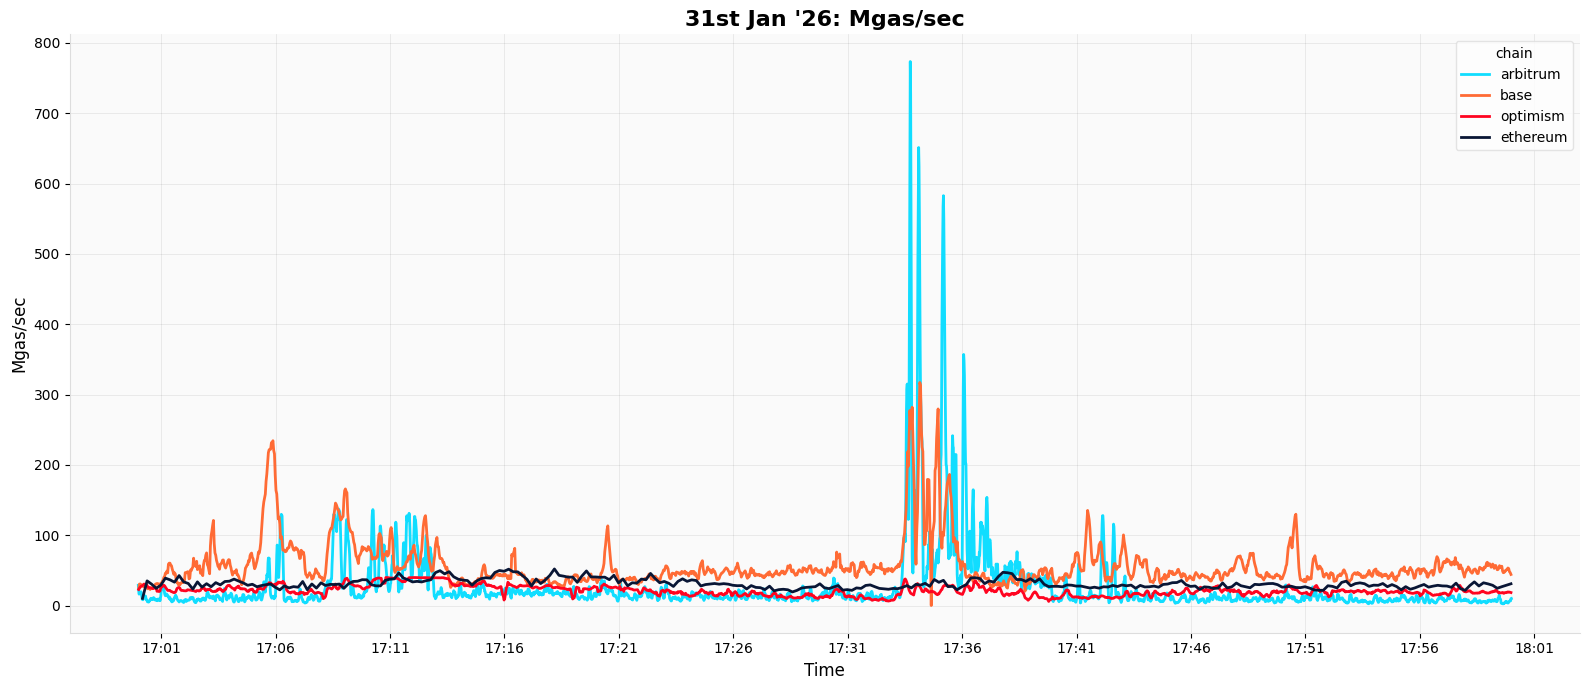
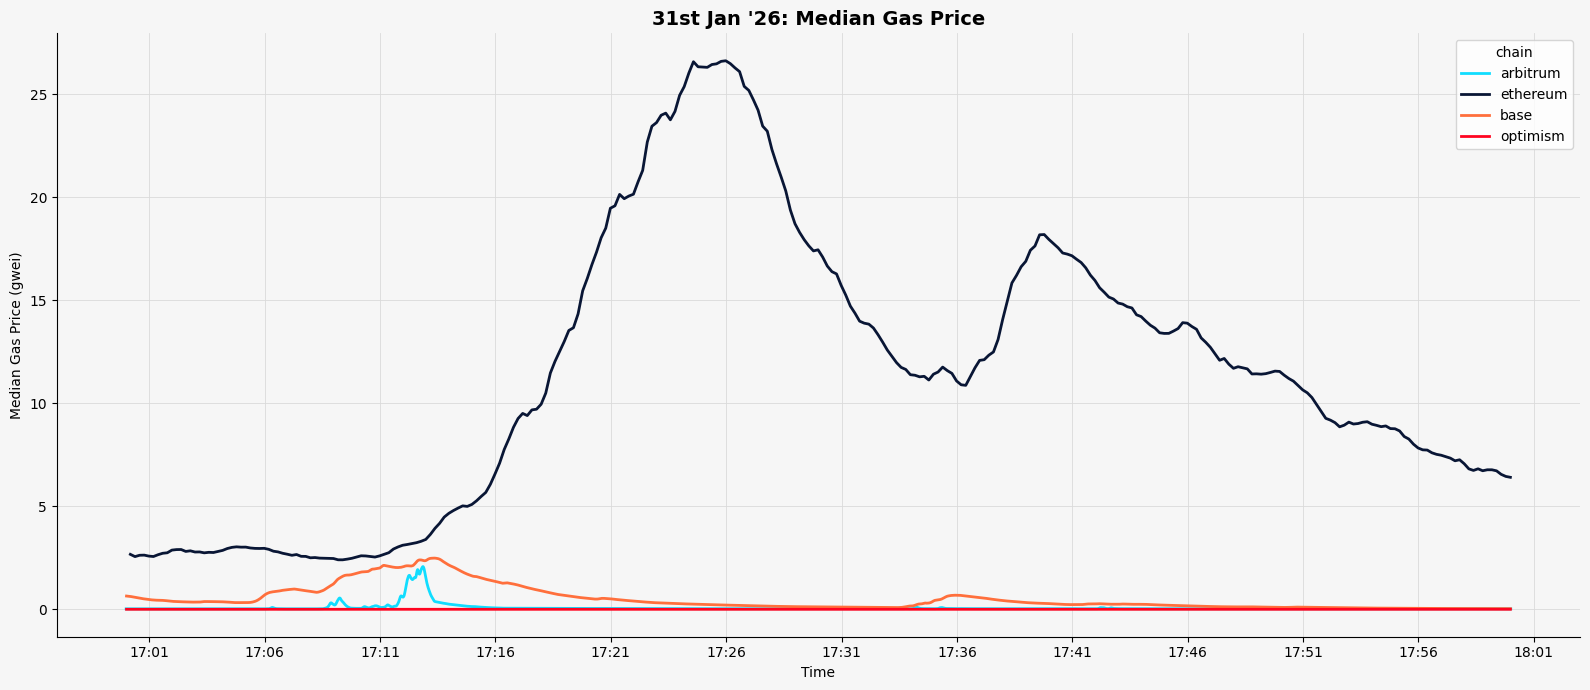
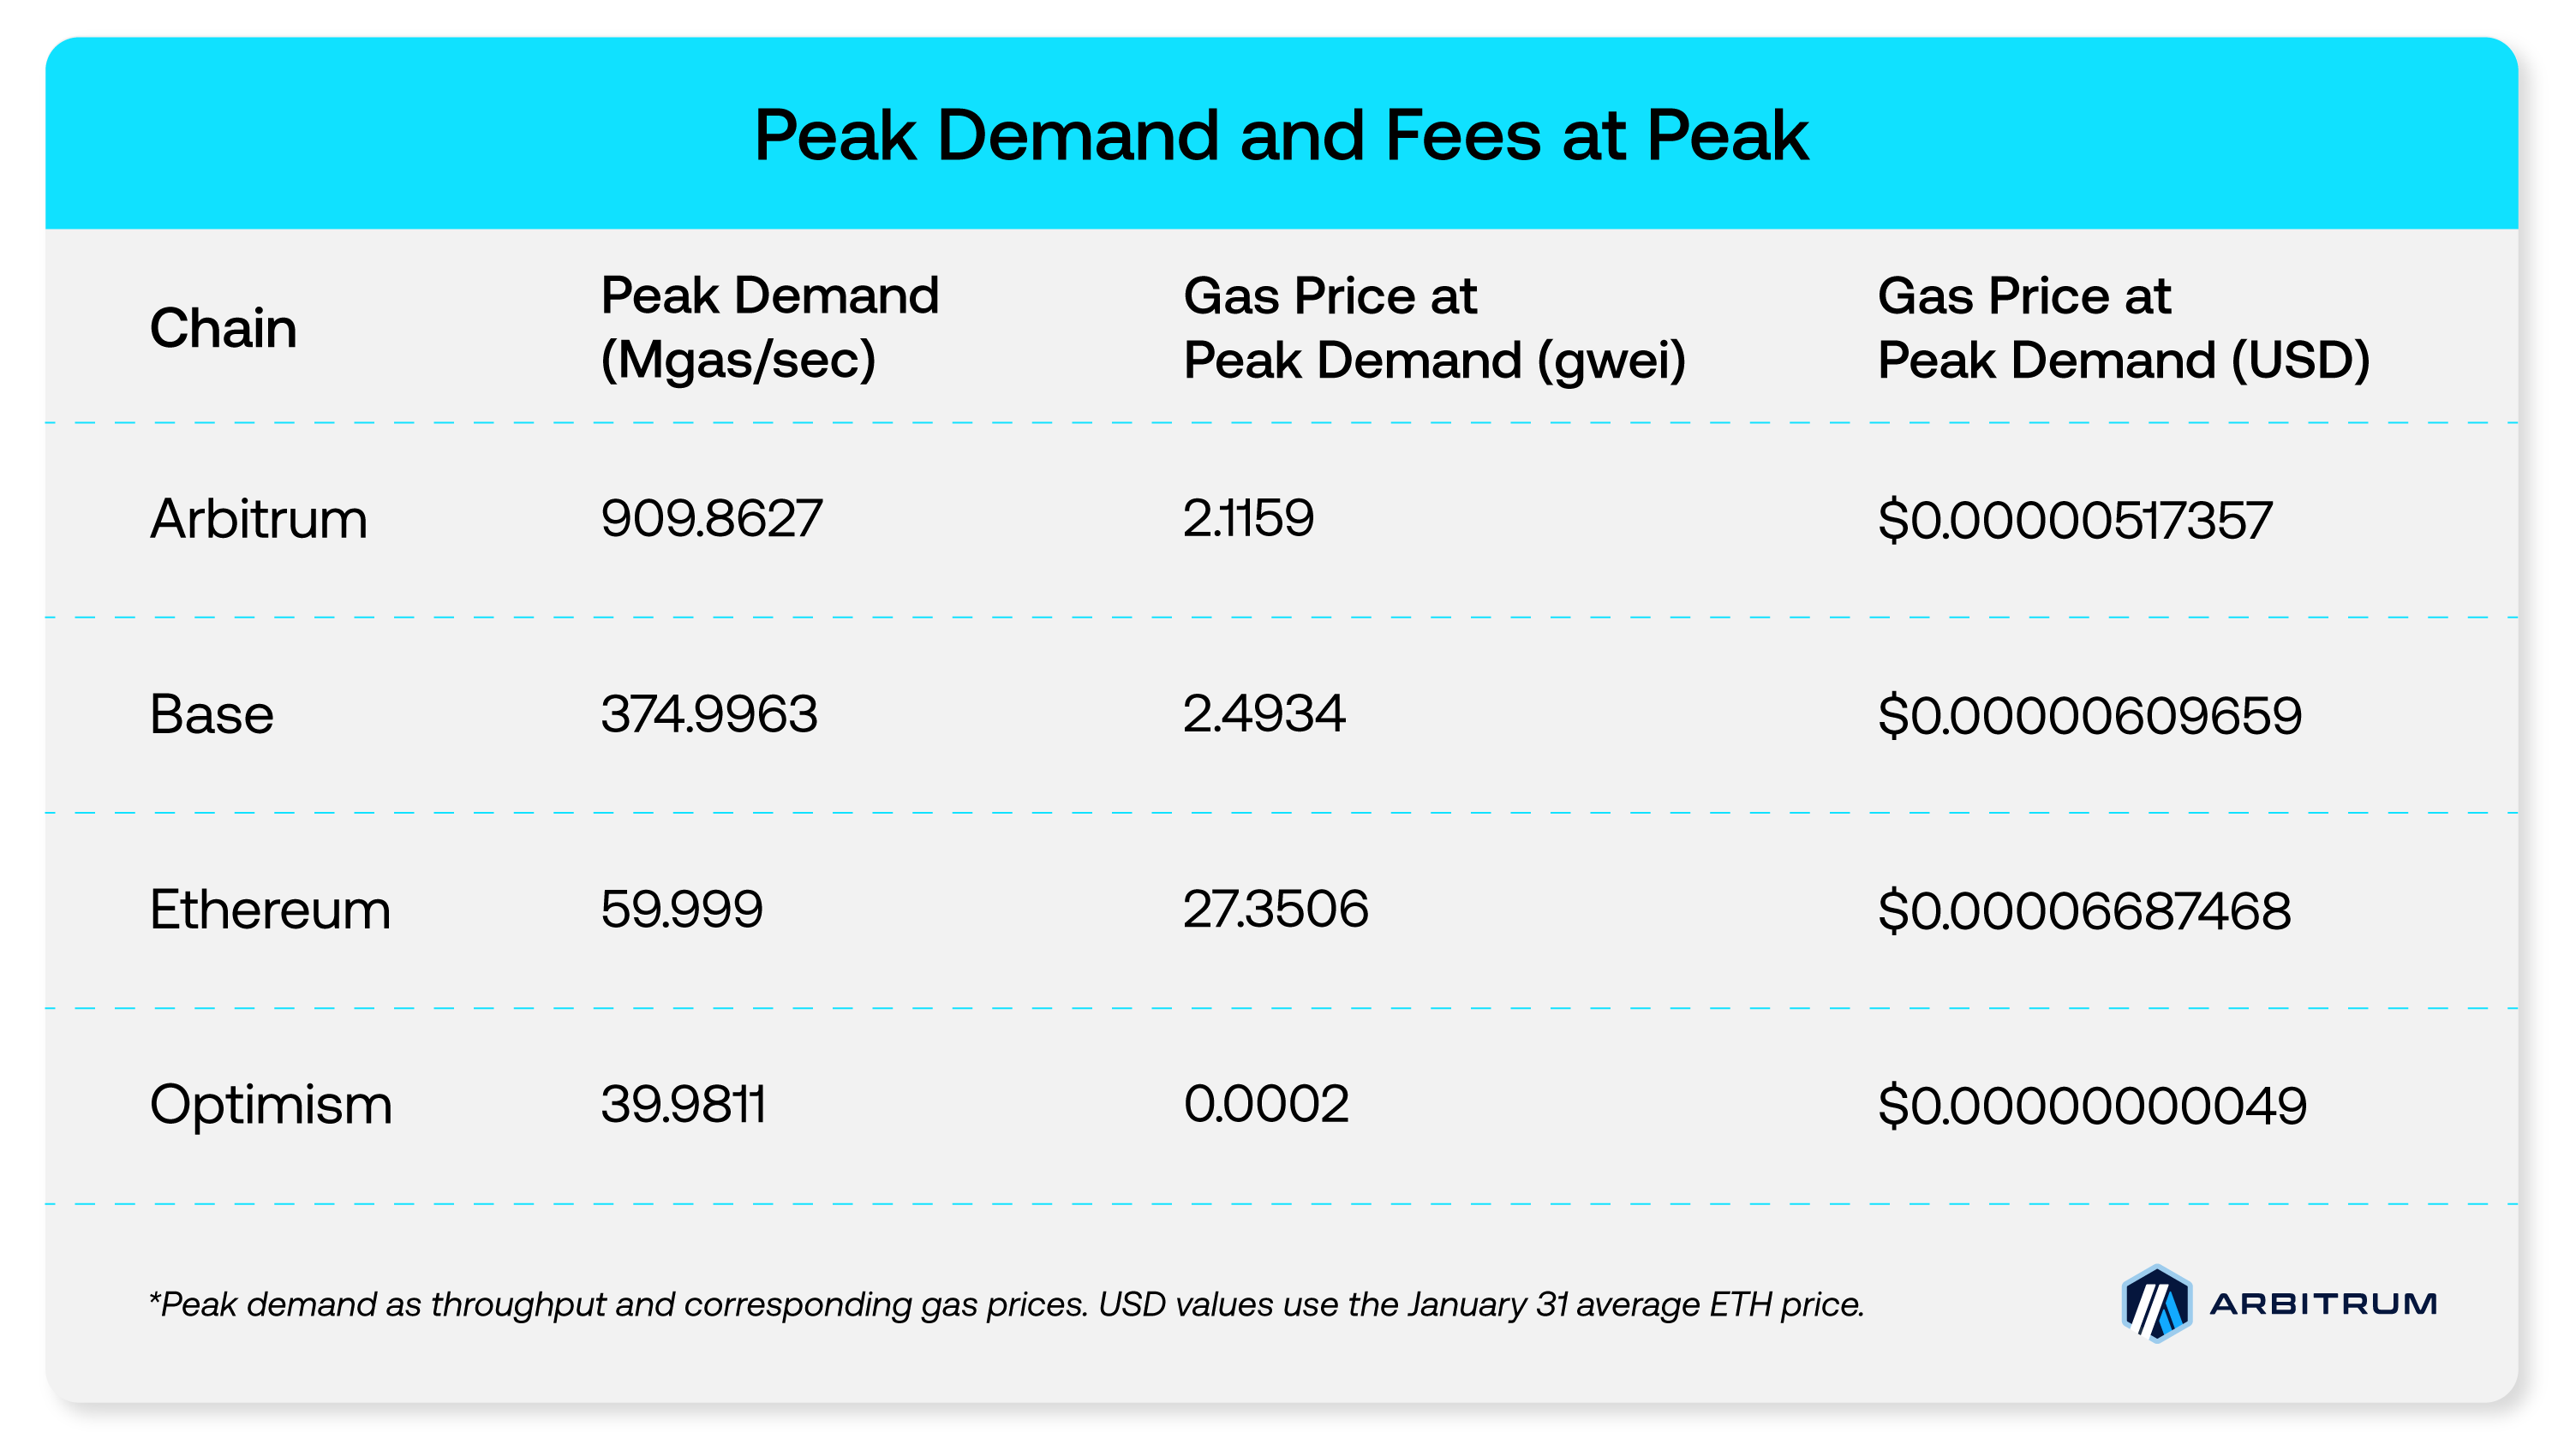
- Higher peak throughput with lower fees: Arbitrum saw the highest peak demand (~910 Mgas/s), about 2.4x Base and 15x Ethereum, while keeping median gas price at peak demand in the low single-digit gwei range (~2.12 gwei), comparable to Base (~2.49 gwei) and far below Ethereum (~27.35 gwei).
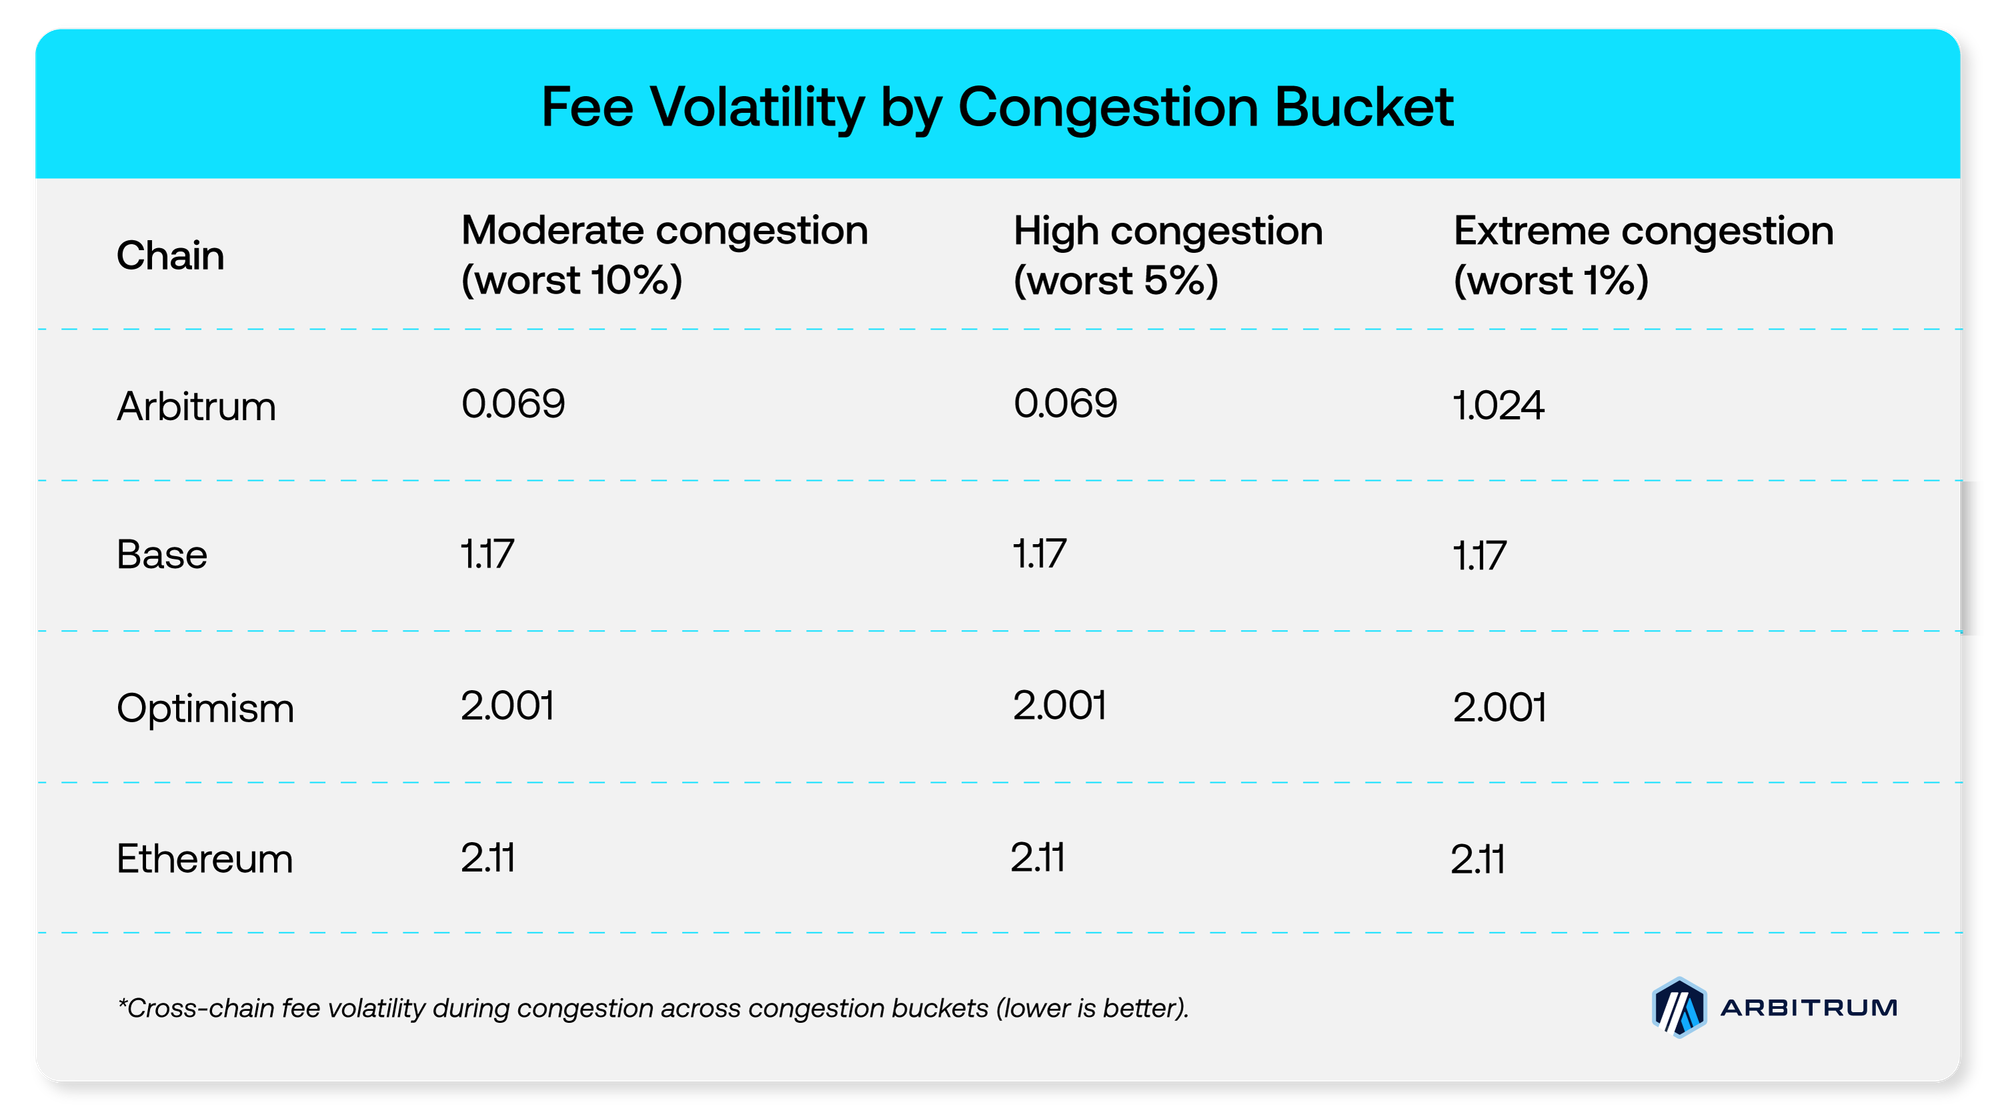
- Lower fee volatility under congestion: Arbitrum showed lower fee volatility scores across all congestion buckets (moderate, high, and extreme) in this dataset.
The four metrics that impact performance
When teams say “fees are unpredictable,” it usually maps to one or more of these measurable behaviors:
Peak cost: How high fees spike during a burst, relative to baseline. This is the pure cost ceiling problem. Once fees cross a threshold that feels “not worth it” for a given user action, usage drops. Even if transactions still land, higher peak prices can directly deter activity, reduce conversion, and push users to postpone or abandon actions entirely.
Cooldown time: How quickly fees return to typical levels after demand falls. This determines how long your app operates with elevated prices.
Fee volatility during congestion: How choppy fees are while a backlog exists, not just how high they get. We observe that this is often the biggest UX breaker. When fees swing quickly, transactions cannot be reliably landed in the next few blocks. Users see transactions that hang with inconsistent confirmation times or completely fail. Apps end up adding larger fee buffers, showing confusing fee ranges, or building retry logic and queues, all of which make the product feel unreliable even if average fees look fine.
Throughput at peak: How much demand the chain absorbs at high utilization without turning pricing into cliffs. High throughput only helps if fee behavior remains predictable enough to keep UX stable.
Fee volatility: a cross-chain view
To compare how steady fees are across networks during congestion, a fee volatility score was measured across multiple chains using median gas prices by second (calculated as the variance in the log median gas prices). Lower scores mean fees move around less when the chain is busy. This comparison is provided as context on fee behavior during congestion, not as a holistic ranking or a full cost comparison.
This analysis groups activity into three congestion buckets (worst 10%, worst 5%, worst 1% by congestion intensity):
How to use this information as an enterprise or financial institution:
- This is a congestion volatility lens, not a full transaction fee model.
- Workload mix and fee stacks differ across networks.
- For apps that depend on consistent transaction inclusion, lower fee volatility during congestion is often more relevant than average fees.
- Always consider variables that are specific to your business or use case when evaluating this information.
This comparison suggests Arbitrum’s fees fluctuate less during congestion in this dataset, especially in the moderate and high buckets where many real-world spikes occur. For enterprises and financial institutions, lower fee volatility supports more predictable cost envelopes and steadier execution during demand surges.
What was observed on Jan 31, 2026
After the cross-chain view sets context, the Jan 31 case study shows Dynamic Pricing in action on a recent day with a particularly high demand profile. These same-period comparisons are directional and do not control for workload mix, fee stack differences, or application composition.
Lower peak response under the same demand trace
Looking at the Jan 31 demand profile, Dynamic Pricing materially dampens the worst gas price spike behavior. At around 130 Mgas/s demand, peak gas price was 98% lower using the Dynamic Pricing model compared to the older model.
For the same demand shock, Dynamic Pricing greatly reduced the maximum fee surge apps and users felt.
High throughput while maintaining stable fee behavior
During the Jan 31 congestion window, performance was compared across the top three L2s, Arbitrum, Base, and Optimism, alongside Ethereum L1 for context. Arbitrum experienced the highest peak demand at ~910 Mgas/s, more than 2x Base at ~375 Mgas/s and far above Optimism at ~60 Mgas/s (Ethereum peaked around ~40 Mgas/s). Despite absorbing substantially higher demand, Arbitrum kept median fees at its peak-demand moment in the low single digit gwei range (~2.12 gwei).
The takeaway is that Arbitrum sustained materially higher peak load without fees running away, demonstrating the “capacity plus predictability” behavior required for high-volume production usage.
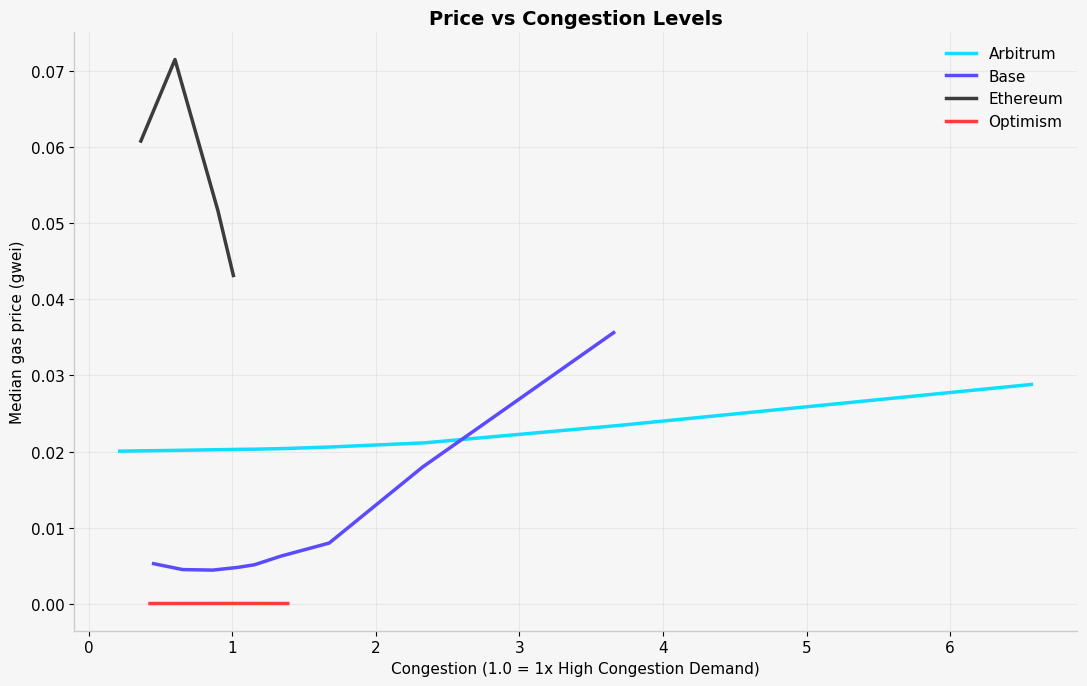
Fees remain stable as congestion scales
This view normalizes congestion so it is easy to compare behavior as demand ramps up. A value of 1.0 means the network is at its worst 5% congestion or p95 demand. 2.0 means 2x that p95 demand, and so on. Those multiples show up during bursty events like market volatility, liquidation cascades, promotions, or large batch operations where many users act at once. In this window, Arbitrum reached more than 6x its p95 demand, which is why its curve extends much farther than the others.
The takeaway is how quickly fees respond as congestion scales. The data shows that Arbitrum’s median gas price increases gradually even at high multiples of p95 demand. Base stays low at first, then rises quickly once congestion begins to climb, indicating a sharper fee spike. Optimism and Ethereum saw much less demand in this window, so there are fewer data points, and Ethereum immediately starts from a higher price level.
What to measure when demand surges
Production systems should use fee economics to adjust the chain’s demand appropriately with respect to capacity: raising prices when busy and lowering prices when usage cools.
A simple monitoring checklist:
- Peak amplification: peak-to-median base fee ratio during bursts
- Cooldown: time to return to the minimum after demand drops
- Fee volatility: how much fees swing during congestion
- User impact: retries, dropped submissions, and the fee buffers applied during congestion
The early data in this addendum indicates that Arbitrum is already operating with the kind of stability and headroom apps need as onchain demand grows. Across stress-oriented comparisons and a real high-load case study, pricing behavior showed reduced fee turbulence, faster recovery, and strong peak throughput without harming users. In practice, this translates to more consistent transaction inclusion behavior during spikes and less need for aggressive fee padding.
As more users and businesses move onchain, demand will increasingly arrive in bursts, not smooth curves. These results suggest Arbitrum’s Dynamic Pricing approach is doing what institutions need it to do: absorb high demand while keeping fee behavior predictable enough to ship reliable user experiences at scale.